
A comprehensive study on damage prediction of pile foundations of inclined high rise buildings and the effect of compaction grouting

Project profile
The Fujian Zhangzhou Junlin Huafu 16# building is a residential structure that has 23 stories above ground and one floor below. It is approximately 43.0 m long, 18.8 m wide and 70.2 m high. The basement floor is 5 m high, while the ground floor is 3 m high. The wall is a shear wall structure and the building foundation is a pile-cap foundation with a cap thickness of 1.5 m. The pre-stressed high-strength C80 concrete pipe piles are utilized beneath the pile cap. The design diameter is 500 millimeters and the effective design length is 11 to 30 m. The architectural engineering drawings and on-site pictures are shown in Figs. 1 and 2. The bearing stratum of piles is fully weathered granite or granular, strongly weathered granite. The characteristics of pile foundation materials are shown in Table 1.

Engineering drawings of the building: (a) Engineering plan; (b) Engineering elevations.
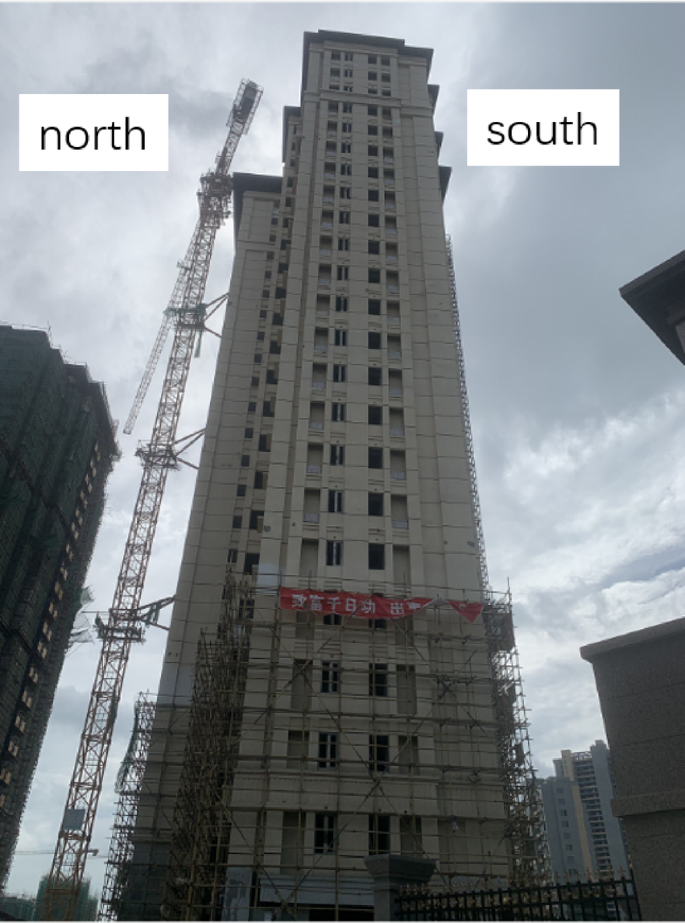
Physical photograph of the building.
The average pile length in the building’s west is 12.6 m and fails to enter the medium sand layer. On the other hand, the average pile length in the eastern half of the building is 14.3 m. The pile ends enter the medium sand layer but do not enter fully weathered granite or granular strongly weathered granite.
Engineering geological conditions
The geotechnical investigation identified a stratigraphic profile. From top to bottom, it is comprised of miscellaneous fill, fine sand, silty soil, medium sand, fully weathered granite, granular strongly weathered granite and moderately weathered granite. Differences between the supplemental and original survey findings uncover that the preliminary survey was not comprehensive, which is also a factor in building settlement.
The engineering geology section is depicted in Fig. 3.

Engineering geologic profile.
Based on surveys and indoor tests, the characteristic values of the foundation soil’s bearing capacity \({f_{ak}}\) and compression modulus \({E_{S1 – 2}}\) for each geotechnical soil layer are presented in Table 2.
The groundwater regime at the site primarily consists of submerged water in miscellaneous fill and fine sand layers, confined water in medium sand, pore-fissure water in fully/strongly weathered granite and micro-confined water in moderately weathered granite.
Field monitoring program
Layout of measurement points
On-site tilt and settlement monitoring points were set up. 16 settlement monitoring points were built up on the site during the lifting phase and surveillance was carried out once every day. The layout of these measurement points is depicted in Fig. 4. The theodolite projection technique was used to monitor tilt, which calculates the displacement of the top observation point in relation to the bottom one; the tilt was derived based on the building’s height.

Engineering geologic profile.
Criteria for deformation control
In accordance with the Code for Measurement of Building Deformation (JGJ8-2016)34 a building is deemed to have stabilized if its settlement rate during the last 100 days is between 0.01 mm/d and 0.04 mm/d. However, the exact maximum settlement rate for a certain observation project should be determined by combining the local foundation soil’s compression properties.
The 16# building at Junlin Huafu is 70.2 m high, as stated in the Technical Procedures for Tilt Correction of Buildings (JGJ270-2012)35. The criterion for the building’s tilt correction can be expressed as follows:
$$\begin{aligned} {S_H} \leq 0.0025Hg \quad 60
(1)
where, \({S_H}\) denotes the design control value for the horizontal deflection at the building’s top; \(Hg\) represents the height of the building from the ground level outside. Equation (1) calculation show that the building satisfies the correction requirements when the tilt is smaller than 175.5 mm.
The walls of the building are made of C40 concrete from the basement to the fourth story above ground, C35 concrete from floors five through nine and C30 concrete from floors ten to roof level. For floor slabs, C30 concrete is utilized from the basement to the tenth floor above ground, whereas C25 concrete is utilized from the eleventh floor to the roof. Cracks were formed in the basement wall on the basement level. Tensile stress for C30 concrete is regulated to a maximum of 2.01 N/mm² in compliance with the Concrete Structure Design Standard (GB/T50107-2010)36.
Analysis of site monitoring results
(1) Building settlement.
The most significant cumulative settlements were 100 mm and 106 mm, occurring at measuring points F1 and F4 on the southwest side of the building, respectively, according to settlement observations made between January 6, 2021 and July 18, 2021. The settlement was 57 mm at point F8, while 55 mm was recorded at point F16. In contrast, the northeast side experienced lesser settlements of 11 mm and 26 mm, with points F9 and F13, respectively. Further observations between July 18 and September 7 revealed a relatively stable settlement with cumulative changes ranging from 1 mm to 3 mm.
(2) Building inclination.
A horizontal displacement of approximately 228 mm towards the south with a tilt of 3‰ occurred at the building’s summit on July 16, 2021. It exceeded the permissible limit of 2.5‰, according to the Technical Regulations for Correcting Tilting of Buildings (JGJ270-2012)35.
(3) Cracks at the junction of the basement.
No visible cracks were observed in the main structure above the ± 0.000 elevation. However, there were visible cracks at the junctions on the basement level. A portion of these fissures were regularly oriented 45° towards the south, as depicted in Fig. 5.

Cracks in the basement wall.
Aiming at the current situation of settlement, inclination and buildings’ structural cracks, 11 groups of numerical simulation working conditions were designed. Through numerical simulation, the causes of building settlement and inclination were analyzed and the best deviation correction scheme was obtained. The design of the simulated working conditions is shown in Table 3.
Numerical simulation analysis of building settlement
Numerical modeling
As shown in Fig. 6, a numerical model of the building and soil layer utilizing PLAXIS 3D finite element analysis software is established. According to the geological survey data, a numerical model measuring 150 m in the east-west direction and 110 m in the north-south direction was established. And incorporating six soil layers with a total thickness of 40 m to eliminate potential boundary effects. The building, pile cap and grouting reinforcement area are densely meshed. For simulation, the top surface employs a free boundary and the bottom surface employs a fixed boundary, while displacement boundaries restrict horizontal movement on the sides. Interface elements are introduced between the soil and the building to simulate their interaction. Referring to relevant literature, the strength of the interface material in this project is set to 0.67 times that of the adjacent soil37,38,39,40,41. The model consists of 501,979 nodes and 221,412 zones.

In the numerical simulations, we apply the hardening soil model with small-strain stiffness (HSS) to simulate the elastic-plastic behavior of soil, which is a double hardening effective stress model that incorporates the Mohr-Coulomb yield criterion. The HSS model can reasonably consider the nonlinear variation characteristics of the modulus in the elastic (small strain) stage. It may also take into account the compressive hardness and shear expansion characteristics of soft soil and distinguish the loading and unloading stiffness. Therefore, during the foundation grouting deviation correction procedure, it is more consistent with the intricate variation features within the soil37,39,40,41,42. Consequently, HSS is chosen as the constitutive model of the soil in this simulation. Soil parameters derived from indoor tests are employed, as detailed in Table 4. A linear elastic non-porous model is used at the pile cap and shear walls. Based on the engineering investigation report, stiffness values are assigned at 3 × 10⁷ kN/m2. For the simulation of pile foundations, there are generally two methods: one is using volumetric elements and the other is using beam elements. Among them, the volume element method will make the numerical model very complex, which is prone to causing mesh distortion and leading to calculation errors. In addition, the axial force of the volumetric element cannot be directly extracted, so the axial force after its indirect conversion may also have errors. The beam method can not only greatly simplify the model and directly obtain the axial force but also effectively handle the interaction relationship between the pile and the surrounding soil40,43. Therefore, the beam method is widely adopted at present to simulate the pile foundation. The unique embedded pile element of PLAXIS 3D is composed of the beam element and the embedded interface element. The element simulates the pile and soil interaction through special interface elements. And the behavior of the interface is described by the elastic and plastic model. The interface element couples the pile’s local skin friction with the strength parameters of the surrounding soil layer and the interface strength reduction coefficient. Table 5 displays the pile foundation’s specifications37,39.
Based on Table 2, to accurately analyze the causes of building settlement and inclination, Cases 2 and 3 are shown in Table 6.
Case 1
The model activates six soil layers, deactivates the soil element beneath the basement and activates the platform pile foundation and the building structure to simulate the deformation and forces experienced by the structure. Figure 7 provides a visual representation of the simulation for Case 1.

Numerical simulation Case 1.
In Case 2, the simulated pile foundation lengths are changed according to the stratum of weathered rock within the model. In Case 2 − 1, all piles were designed with the minimum original length of 12.6 m, ensuring that no pile end touches the fully weathered rock layer. In Case 2–2, all piles adopted the maximum original length of 14.3 m, ensuring that the pile ends reached the top of the completely worn rock stratum. Figure 8 depicts the simulated behavior in Case 2 − 1 and Case 2–2.

Numerical simulation Case 2.
The presence of weak strata in the foundation’s upper portion can significantly impair its bearing capacity. So, the top soil type is adjusted in the simulation. In Case 3 − 1, fine sand replaces the top miscellaneous fill, while in Case 3 − 2, medium sand replaces it. Figure 9 presents the visual overview of the simulations for Case 3 − 1 and Case 3 − 2.

Numerical simulation Case 3.
Numerical simulation results
The deformation pattern for buildings in Case 1 is shown in Fig. 10. Figure 10a and b present the simulated vertical and horizontal displacements at deformation monitoring points in case 1, respectively. Figure 10c shows the comparison between the simulated values and the measured values of the typical vertical monitoring points. According to the figure, the settlement on the southwest side is greater than that on the northeast side and the building leans toward the south. The comparative analysis of the monitoring data and the numerical simulation results shows that the settlement amount of the measurement point F4 on the south side of the building is the largest, while that of the measurement point F13 on the northeast side is the smallest. This distribution characteristic is completely consistent with the simulation results and the relative error of the maximum settlement is only 0.5%. In terms of horizontal deformation, the measured value of the southward displacement of the building roof slab is 228 mm and the simulation result is 238.7 mm. The difference between the two is only 10.7 mm and the relative error is 4.7%, verifying the reliability of the model. It is worth noting that the simulated settlement values of the measurement points F9 and F13 deviate from the measured values by approximately 15%, which is mainly due to the unreasonable surface loading at this location or inaccurate geological survey. In addition, this area has a special underground structure system: A complex force-bearing system is composed of the pile foundation and the rigid connection formed between the shear wall and the basement wall. Then the earth pressure is to be transmitted through the path of the pile foundation, basement wall, shear wall and floor slab. The model simplification carried out to reduce the loss of computing power has also led to certain errors. Despite these minor differences, the model performed exceptionally well in terms of the overall settlement trend, settlement extreme values and horizontal deformation, which demonstrates high accuracy.

Building deformation cloud map in Case 1.
Figure 11 depicts the stress distribution within the building’s basement in Case 1. Peak tensile stresses on the side walls are 6.41 N/mm2, which exceeded the specified concrete tensile strength requirement, causing wall damage. This result is consistent with the noticeable fissures in the basement walls during field visits, supporting the model’s accuracy.

Building Basement Stress Comparison.
The whole deformation cloud diagram of the building is shown in Fig. 12, which shows the building’s settlement and tilt from northeast to southwest. The piles’ shallow penetration into the rock layer may lead to the uneven settlement; on the other hand, the thicker upper weak stratum and the weakened foundation may exacerbate the settlement discrepancy. As the basement structure bears a portion of the load from the uneven settlement, the higher tensile stresses result in basement concrete wall damage.

Overall building deformation cloud map in Case 1.
A comparison result of the vertical deformation at critical measurement points between Case 1, Case 2 − 1 and Case 2–2 is shown in Fig. 13. In Case 2 − 1, the original longer pile foundation on the east side was replaced with a shorter 12.6 m pile foundation on the west side. With the reduction in the eastern piles’ embedment depth into bedrock, the monitoring value from eastern points F8 and F9’s settlement increases significantly. A maximum increase of 70% of the initial settlement values is achieved and the building’s maximum horizontal displacement increases to 239.8 mm. Conversely, in Case 2–2, the short pile measuring 12.6 m on the west side of the foundation is extended to 14.3 m, at which point the pile end touches the weathered rock layer. The western building’s settlement experiences a significant decrease, while the settlement trend on the eastern side is not readily apparent. The maximum settlement of the building decreases from 106.6 mm at point F4 to 60.8 mm at point F1 and the horizontal displacement of the building toward the south decreases from 238.7 mm to 159.7 mm.
Figure 14 presents the stress distribution within the building’s basement for Case 2. 5.82 N/mm2 is the maximum tensile stress in Case 2 − 1, which is less than Case 1. The uneven settlement decreases with the increase of the settlement on the west side caused by the decrease of pile foundation depth. Consequently, the tensile stress of the underground structure caused by the uneven early settlement has decreased. Conversely, in Case 2–2, the foundation’s bearing capacity increased as the pile length increased. As a result, the basement’s tensile stress decreased, reaching a maximum of 3.66 N/mm2.

Comparison of building deformation with different pile lengths.
Figure 15 presents a comparison of vertical deformation at critical measurement points for Case 1, Case 3 − 1 and Case 3 − 2. In Case 3 − 1, fine sand of slightly higher load-bearing capacity replaced the upper miscellaneous fill. In the meantime, a medium sand with a greater load-bearing capacity is utilized in Case 3 − 2. It can be seen in the figure that the settlement and inclination of each measurement point caused a decrease due to the enhancement of the weak upper foundation.

Stress cloud map in the basement of the building in Case 2.

Comparison of deformation of buildings with different weak foundations.
Figure 16 depicts the stress distribution within the building’s basement for Case 3. The maximum tensile stress in Case 3 − 1 has a value of 2.07 kN/m², while for Case 3 − 2 it is 2.06 N/mm². As the foundation bearing capacity increases, the maximum tensile stresses gradually decrease.

Stress cloud map in the basement of the building in Case 3.
The numerical simulations’ findings indicate that while the depth of the pile into the rock has little effect on horizontal deformation. But it has a significant impact on the building’s settlement. The foundation strength has a similar influence on horizontal and vertical deformation, with variations ranging from 10 to 20%. Furthermore, the basement maximum tensile stress decreases as the foundation increases. Therefore, it can be concluded that the building tilt is related to the fragility of the upper foundation layer and the insufficient depth of the pile foundation within the rock.
Analysis of causes of building settlement and tilting
By integrating the geotechnical investigation report with the numerical simulation, the potential causes of the building’s settlement and tilt are as follows.
(1) The pile end is not embedded in the rock mass, or the depth of insertion into the rock is insufficient.
(2) According to the geotechnical investigation report, boulders are encountered within the residual soil layer. And spheroidally weathered cores are present in the fully/strongly weathered granite stratum. During pile driving operations, these obstructions (boulders or spheroidal weathering bodies) may prevent further penetration. Although the bearing capacity requirement of a single pile has been met, there is still a weak layer beneath it. Under the long-term load pressure on the upper part of the building, it will still lead to uneven settlement.
(3) The upper soft soil layer exhibits significant thickness, high compressibility and low bearing capacity. In the event of poor pile foundation quality, this weak stratum cannot provide supplementary load-bearing support, potentially leading to differential settlement.
(4) The completely weathered and fragmented, strongly weathered rock layers deep in the foundation exhibit heterogeneity. It causes the force on the foundation to be uneven.
(5) The moderately weathered granite bedrock has an irregular interface elevation. That may induce lateral displacement of pile foundations under superstructure loading. Consequently, the pile foundations’ vertical bearing capacity has reduced.
(6) The foundation soils contain granite residual soils and completely/strongly weathered granite layers. These residual soils and weathered rocks are prone to softening and disintegration upon water immersion, leading to significant strength reduction and poor stability.
Therefore, it is necessary to reinforce the soil around the pile and the pile end’s bearing stratum. Correct the building’s deviation to keep the inclination within the allowable range of the code.
link